Server Side Stories: Tracing Data Center Expansions Through Shifts in Regional Streaming Popularity Metrics
Avery Russell · Oct 27, 2026
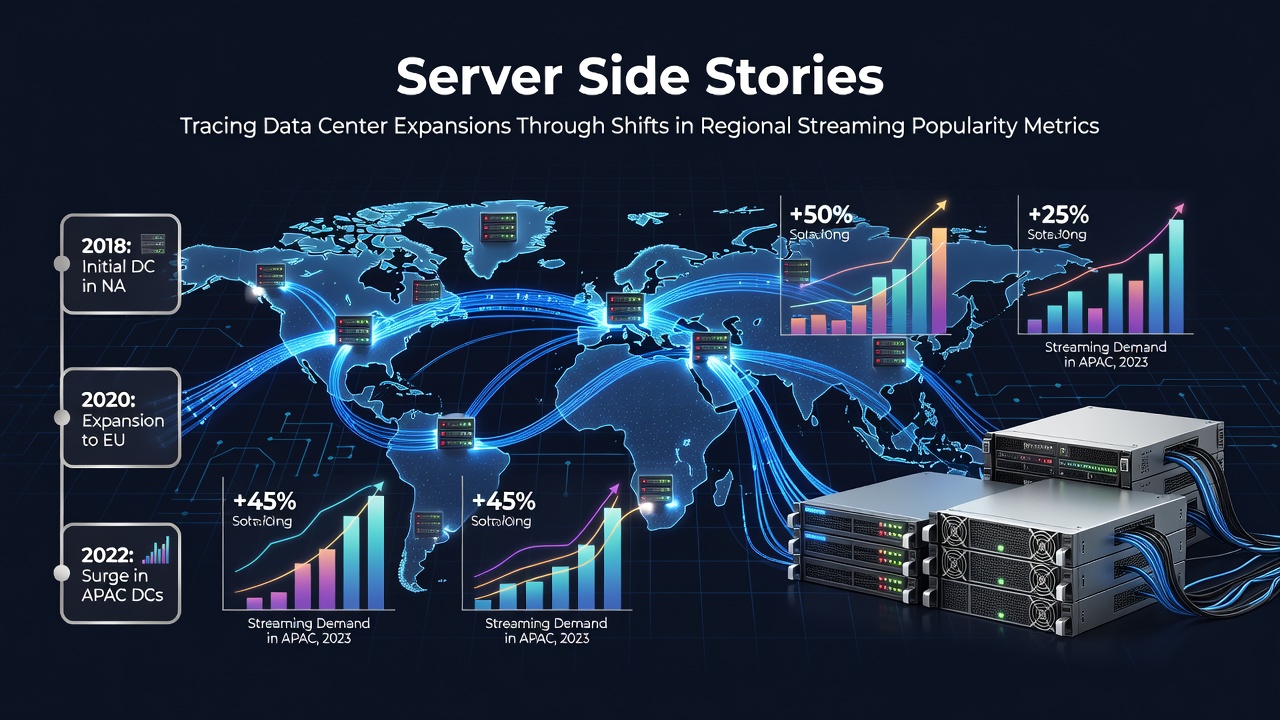
Server Side Stories: Tracing Data Center Expansions Through Shifts in Regional Streaming Popularity Metrics
Streaming platforms track viewership data across continents and those metrics increasingly guide where companies locate new data centers, as operators respond to demand spikes in specific markets rather than spreading infrastructure evenly. In October 2026, industry analysts continue to map how hours streamed in emerging regions correlate with construction announcements from major cloud providers.
Regional Popularity Shifts Drive Infrastructure Decisions
Viewership growth in Southeast Asia outpaced North American figures by substantial margins during 2025 according to aggregated platform reports, and that pattern prompted accelerated builds in Singapore, Jakarta, and Kuala Lumpur. Researchers tracking content consumption note that local language titles and live events pull sustained audience hours, which in turn raises requirements for low-latency delivery and local storage capacity.
Data centers require proximity to users to reduce transmission delays, so operators examine popularity indexes before committing capital. One study from an academic research group in Australia highlighted how a 40 percent rise in regional streaming minutes preceded three new facility projects within eighteen months, illustrating the direct pipeline from metrics to physical expansion.
Case Examples of Metric-Influenced Builds
European providers expanded capacity near Warsaw after Polish and neighboring markets showed elevated engagement with on-demand libraries and live channels, while similar patterns emerged in parts of South America where Portuguese and Spanish language content gained traction. Observers note that companies review anonymized session data broken down by city clusters to prioritize sites with fiber connectivity and power availability.
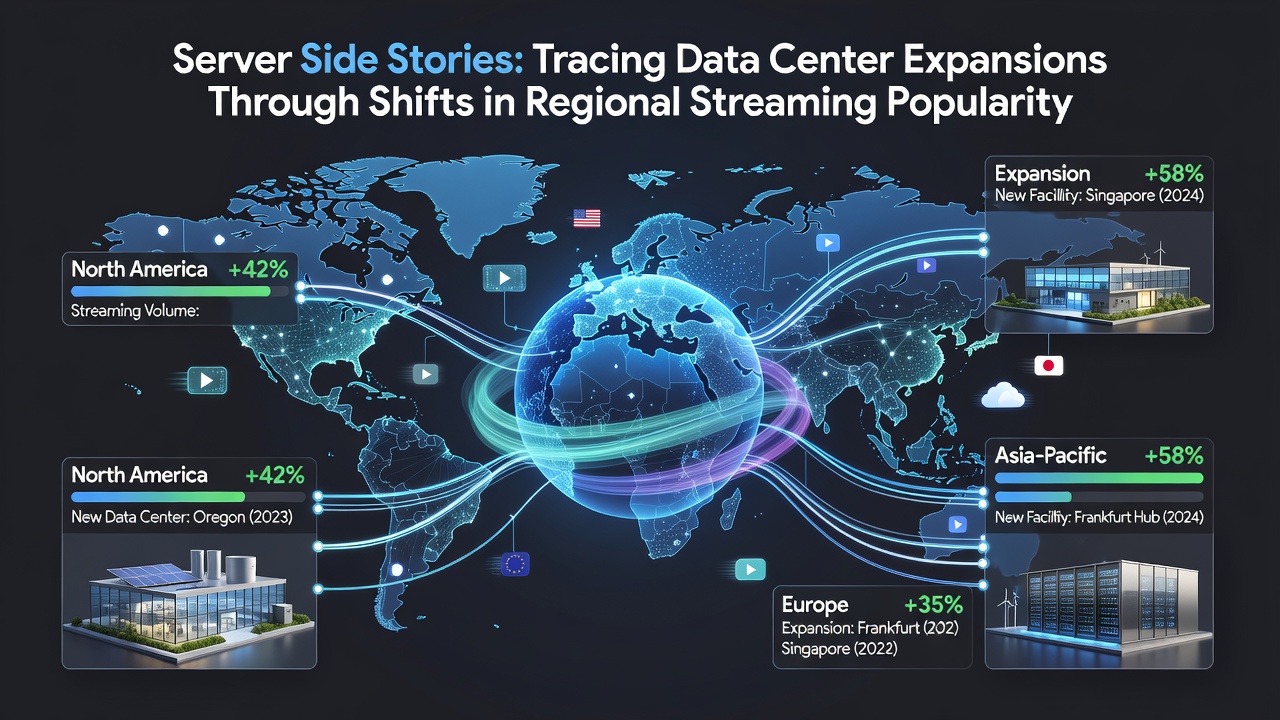
Construction timelines often align with quarterly popularity reports released by streaming services themselves, allowing planners to adjust square footage and cooling systems to projected loads. Government agencies in Canada have published infrastructure overviews that reference streaming traffic growth as one factor among several influencing new builds in Ontario and Quebec.
Technical and Economic Factors at Play
Bandwidth consumption per viewer has climbed with higher resolution formats, so regional surges translate into measurable increases in egress traffic that existing facilities struggle to handle during peak windows. Providers therefore evaluate both average daily active users and peak concurrent streams when modeling future data center needs.
Power purchase agreements and land availability remain decisive, yet popularity metrics supply the demand forecast that justifies those investments. Trade organizations focused on digital infrastructure have compiled datasets showing that facilities sited according to streaming heat maps achieve higher utilization rates than those placed without such analysis.
Global Patterns Observed in 2026
Shifts continue in markets such as India and Brazil where mobile-first viewing dominates, leading hyperscale operators to announce additional edge nodes rather than single large campuses. Figures released by research institutions indicate that these distributed builds reduce average latency by double-digit percentages in high-growth zones.
Planners combine public streaming charts with private telemetry to refine site selection, while regulatory bodies in the European Union track overall data center energy use against the backdrop of expanding regional demand. The result is a feedback loop where popularity data informs expansion and expanded capacity in turn supports further audience growth.
Conclusion
Regional streaming popularity metrics function as leading indicators for data center placement decisions across multiple continents, with documented examples in Asia, Europe, and the Americas during 2026. Operators integrate viewership statistics into forecasting models alongside traditional factors like power and connectivity, producing facilities that align more closely with actual consumption patterns. This approach continues to shape infrastructure development as streaming volumes evolve.